Service Management BI for Sage 300 CRE
Connect to Sage 300 Service Management Data with Reports, Analytics, and Dashboards
Tools for managing the COVID-19 Crisis
COVID Management
Manage AR Collections, assess the impact of your COVID budget to your original budget, online Job Forecasting, WIP, and more…
Collect faster and improve cash flow
Get rid of spreadsheets for AR Collection Management
Track the promised payment date of invoices with the AR Collection tool.
Financial ratios are game changers
Build trended ratios with dashboards
Create your own Financial Ratio dashboards with trended days sales in AR, current ratio, quick ratio, or any other liquidity ratio.
The Anterra Advantage
Anterra provides enterprise-quality service management reporting to you at a fraction of the cost. World-class reporting across your organization.
anterraBI™ contains drill-through dashboards, grids, financial statements, scorecards, and analytic tools to quickly see where you are performing outside of your plan.
Anterra solutions are designed to empower people with actionable information. We accomplish this goal by delivering:
- Mobile BI — Browser-based dashboards with drill-down capability enable access to the source information instantly, PC or mobile device
- Ease of use — anterraBI’s interface is built by people with extensive Service Management and Construction experience along with feedback from industry-leading companies.
- Rapid Deployment — Over 200 prebuilt dashboards and reports our clients receive immediate ROI. (Read Customer Success Stories Here)
- Cost-Effectiveness — Cloud-based offering means no additional cost for hardware and no additional burden on your IT staff to maintain the application.
Improve your service and construction company reporting, eliminate manually prepared spreadsheets from your organization, and manage the risk of your business.
Service Management Dashboards & Reports
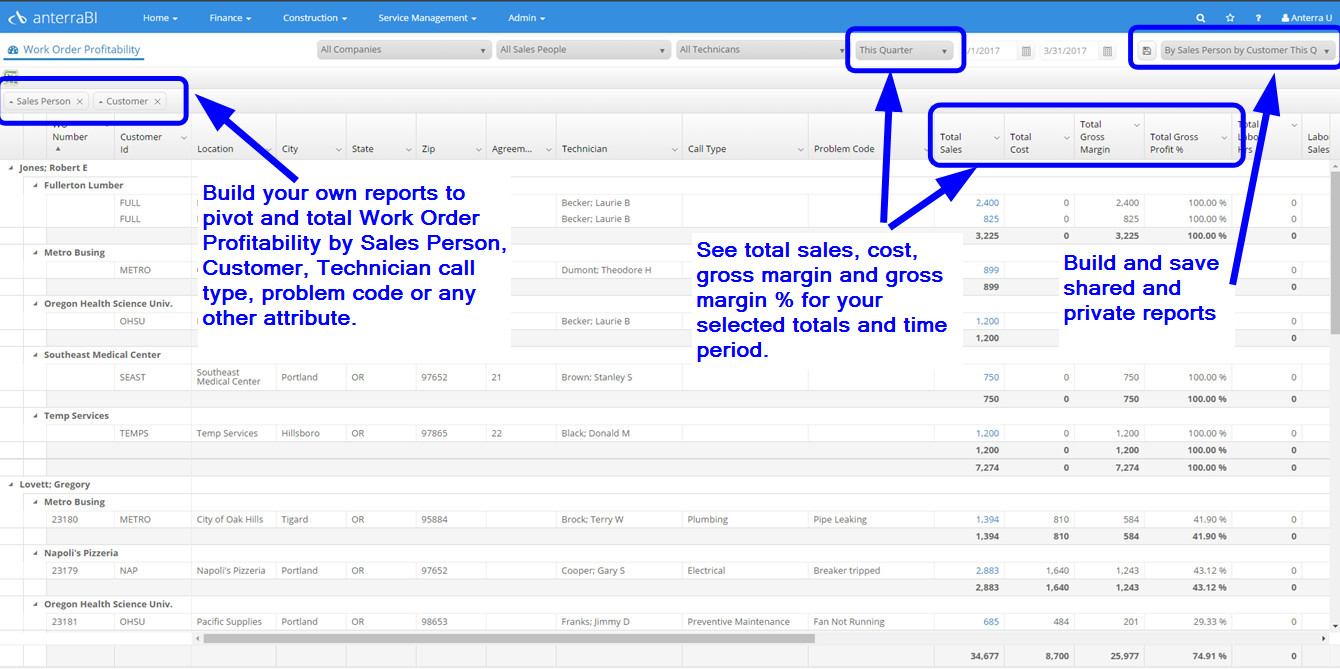
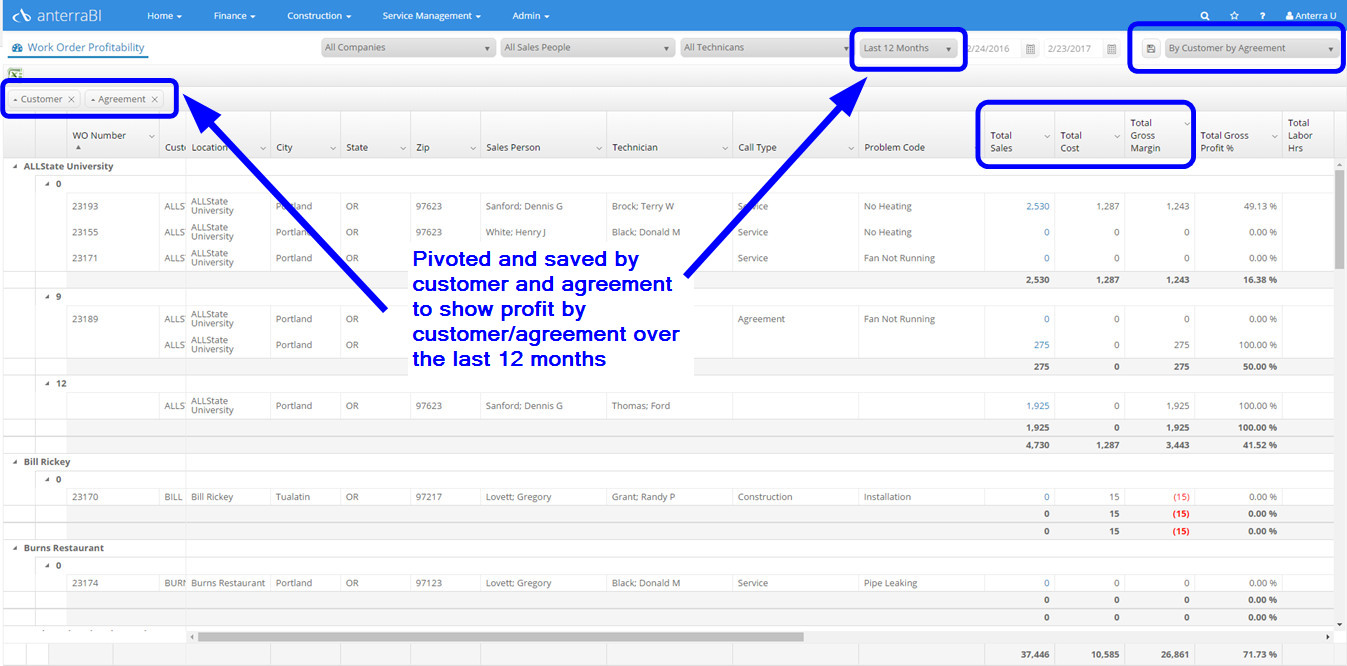
Work Order Profitability
Build reports to show work order profitability over any range of dates by:
- Salesperson
- Technician
- Customer
- Customer location
- Agreement
- Division
- Call Type
- Problem Code
- Geography – city, state, zip
- Any combination of items: Salesperson / Technician, Customer / Technician, Problem Code / Technician
Finally see where you make and lose money in service management with Anterra.
Build any number of profitability reports and share them with other users or create private reports.
Click the below image to watch a YouTube Video covering this feature.

Profitability by Salesperson and by Customer for current quarter
Profitability by Customer and Agreement for the last 12 months
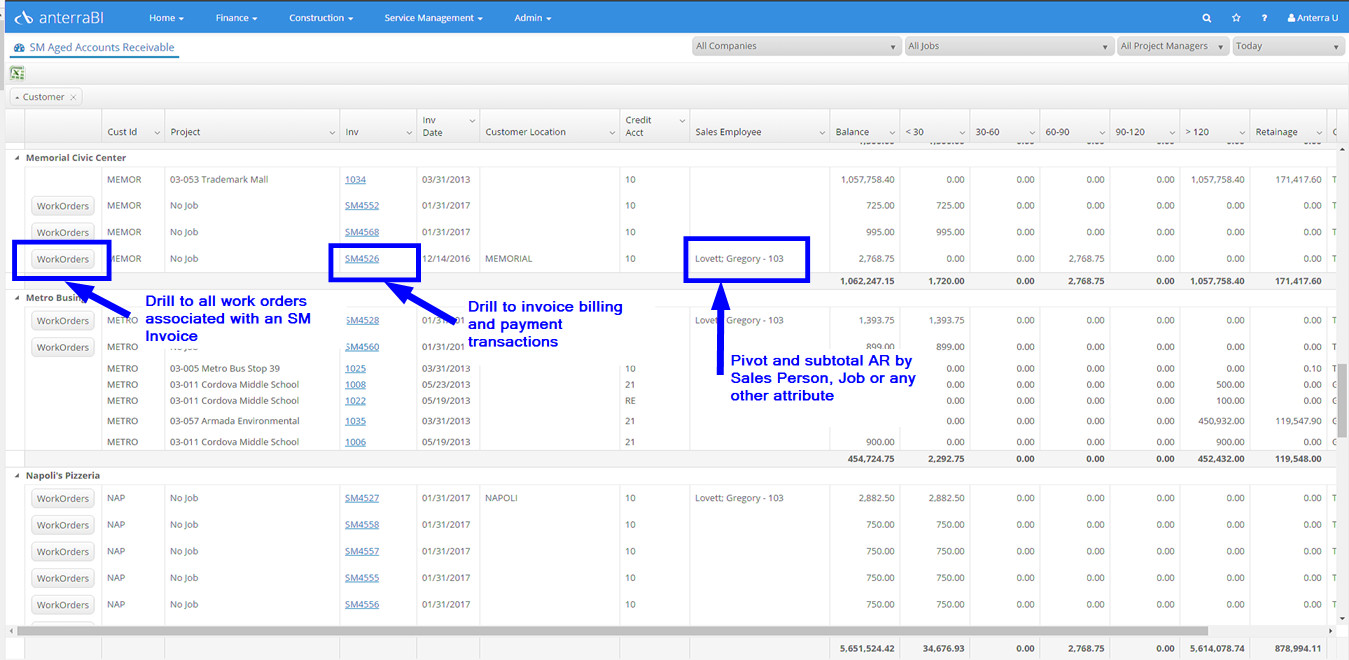
Service Management Accounts Receivable with Work Order Drill-through
Instantly see Accounts Receivable from both Service Management and Construction invoicing. Drill to the invoice number to see invoicing and payment activity. For SM invoices click on the Work Orders button to drill to all of the work orders associated with an invoice.