
Anterra is built for General Contractors
Manage the right key performance indicators. Empower your team and hold them accountable.
Replace spreadsheets for AR Collection management
Collect faster to improve cash flow
Track the promised payment date of invoices with Anterra’s AR Collection system.
Create consolidated Financial Statements
Shorten your month end process
Create consolidations without a 2-year time limit. Consolidate across databases, data folders, servers and accounting systems.
Tools for managing the COVID-19 Crisis
COVID Management
Manage AR Collections, assess the impact of your COVID budget to your original budget, online job forecasting, WIP management, and more…
Construction Business Intelligence Overview
Build BI Dashboards with Construction Margin, Labor, Procurement, Cost, Contract, WIP, Procore, and Financial Performance Components

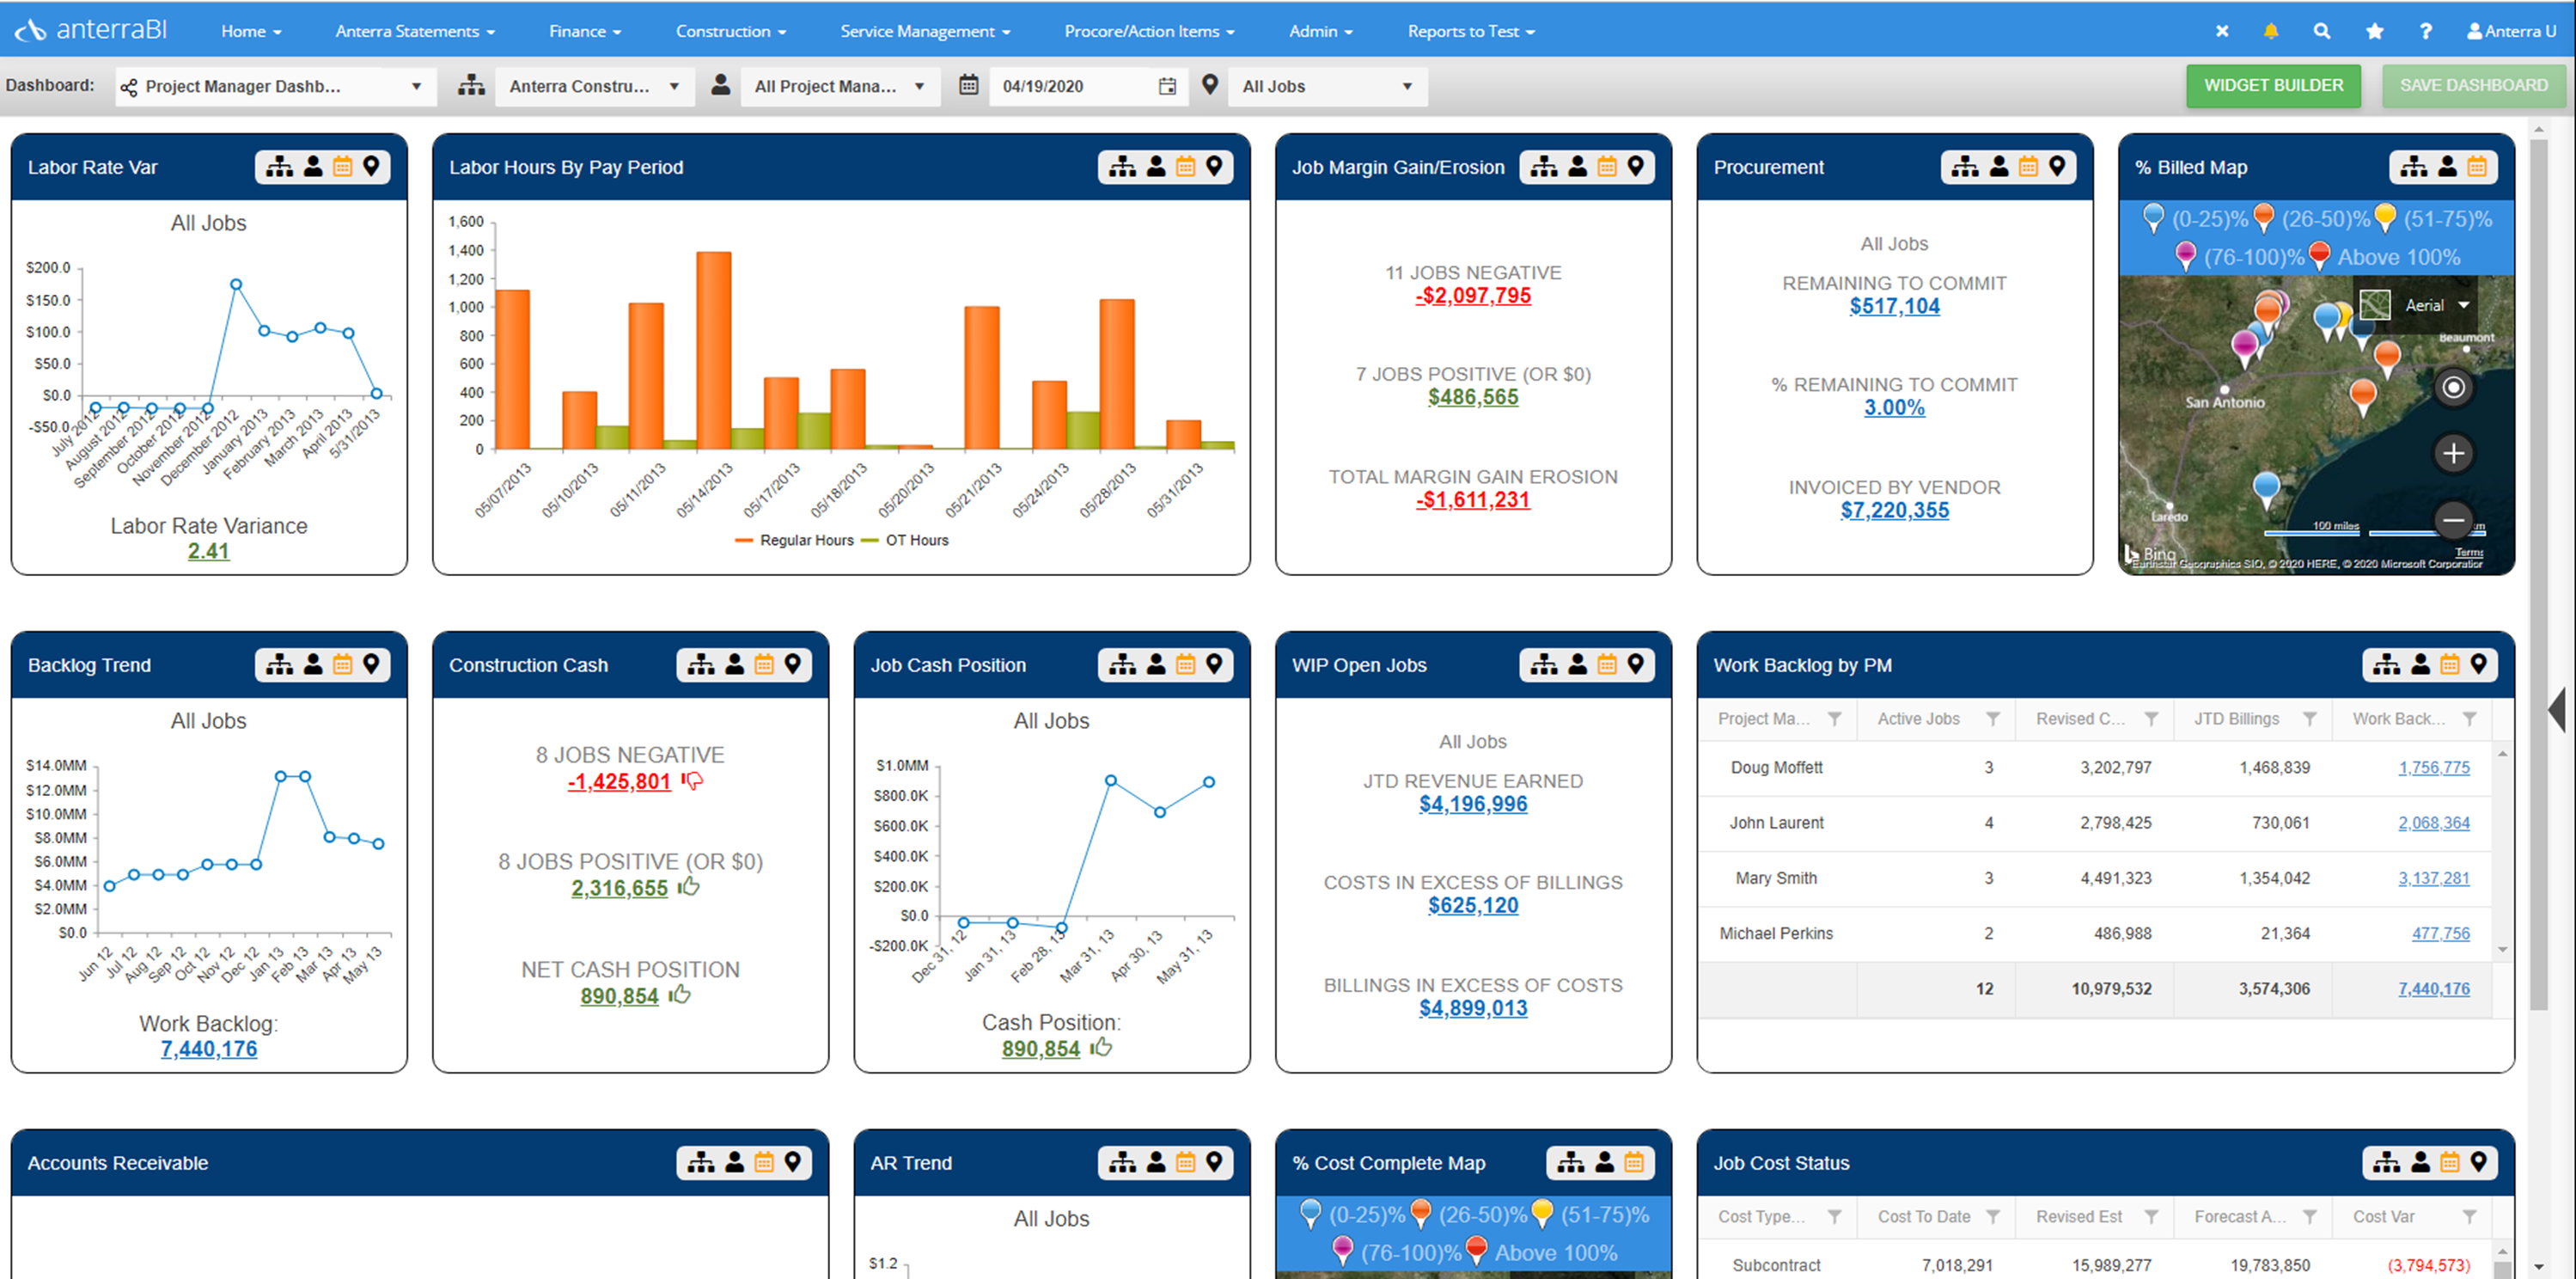
Construction Dashboards
Anterra lets you build your own dashboards from a large selection of key performance indicators.
Dashboards contain graphs and tables for key performance indicators that you should be monitoring but most likely are not able to currently. You could be watching job margin Gain/Fade, job cash position, labor rate variance, remaining to procure and other key risks in construction.
A dashboard administrator can create Shared Dashboards to provide your company a consistent and standard way of looking at your business. Each user can build and save their own dashboard under “My Dashboards” based on their reporting needs and the information you have made available to them through security setup.
Construction dashboards can combine information from your job cost accounting system and Procore.
Dashboards can be filtered by
- Company / Division
- Project Manager
- Date
- Job
Dashboard security can be set by Project Manager so they only see their own jobs.

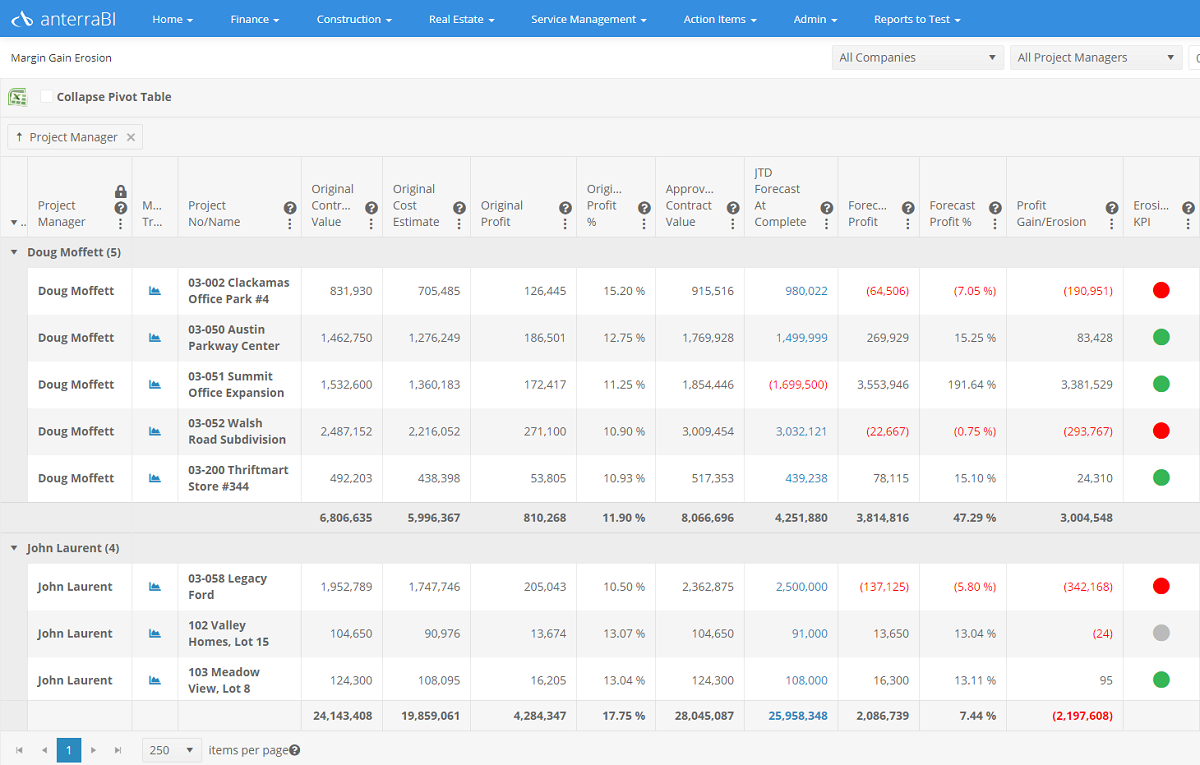
Job Margin Gain / Fade Analysis
Analyze margin gain or fade by any job attribute –
- Project Manager
- Estimator
- Site Super
- Job Type
- Market
- Any custom field on the job record in your accounting system
With Anterra Pivot Grids you can build and save as many views as you like. For example, you could have a view filtered to jobs with approved contract values over $1,000,000 (Major Projects) or under $25,000 (Small Jobs) and set your dollar values to whatever level you like.
Add any column you like to a Pivot Grid. You might want to add Remaining to Procure $ or Remaining Labor Hours to your Margin Gain / Fade analysis if those are factors you can focus on to regain margin.
Build collapsed views of pivot tables that drill all the way down to transactions.
Use these pivot grids to become proactive in your job management, you need to know that your margin is fading as soon as possible to take corrective action.
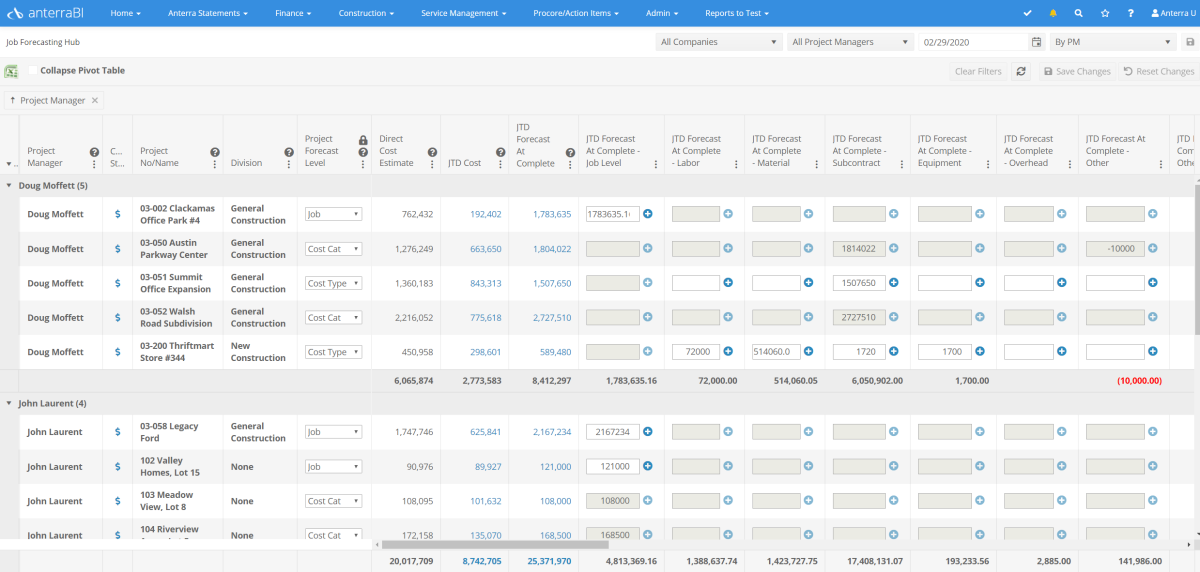
Job Cost Forecasting
- Automatically forecasting cost using 1 of 11 pre-built formulas. Your PMs don’t have to forecast as many items which saves time and focuses the forecast on items at risk of cost overruns. A simple forecast formula takes the highest of Revised Estimate, Revised Committed Cost or Job to Date Cost. We update this formula every time we update your data, so your PM’s only need to forecast off plan items.
- Forecasting jobs at the right level. With Anterra you can forecast small jobs at the job level, medium sized jobs at the cost type level and large jobs at the cost category / cost type level. There is no need to forecast 20 items for a job that has a budget of $5,000 and is 7 weeks long.
- Anterra lets you manage your forecast source by job, we can bring in the forecast from your accounting system, from Procore or Prolog or you can use Anterra. You are in control.
- You can build your own entry grids. Give your project managers the information they need for each type of forecast.
- You can choose which system to forecast in by division or job. Many companies forecast larger jobs in Procore and smaller jobs in their accounting system. You can choose which system to use, we empower you to use the system that best fits your needs – Anterra, Sage, Viewpoint Vista, Procore or soon Acumatica.
Our Job Forecasting Hub controls the forecast – your PM’s have a central location to manage forecasts and can complete their work quickly and accurately.
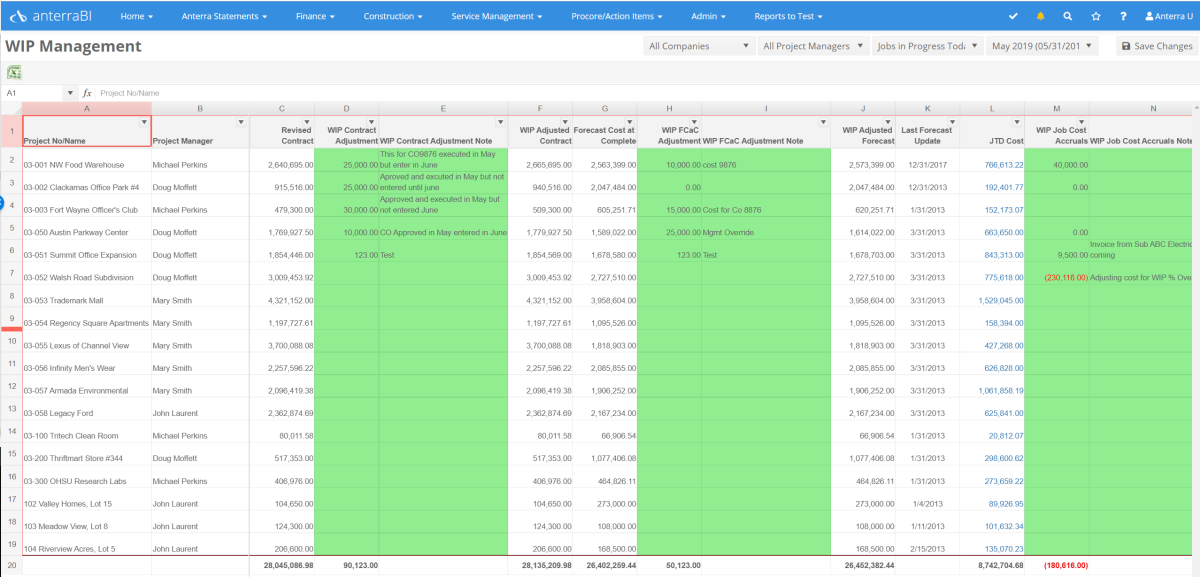
WIP Management
Anterra gets you out of spreadsheets to manage WIP. Our WIP Management grid lets you enter reversing accruals in Anterra for:
- Contract Adjustments
- Forecast Cost at Complete Adjustments
- Job to Date Cost Adjustments (required by ASC606 for uninstalled materials)
- WIP % Complete – simply enter the WIP % complete you want and Anterra will create an accrual entry to balance to your entered % complete
Our WIP Management Grid can display any prior month. Stop digging for “the last version of December’s WIP spreadsheet” on your server.
The WIP Management grid incorporates your company’s Job Forecast Cost at Complete and shows you the last time the forecast was updated by your Project Manager to help you determine if a WIP adjustment is necessary.
Your forecast cost at complete can come from Anterra, Procore or the job cost module of your accounting system.
You can drill to job to date and forecast cost details to determine what adjustments are necessary.
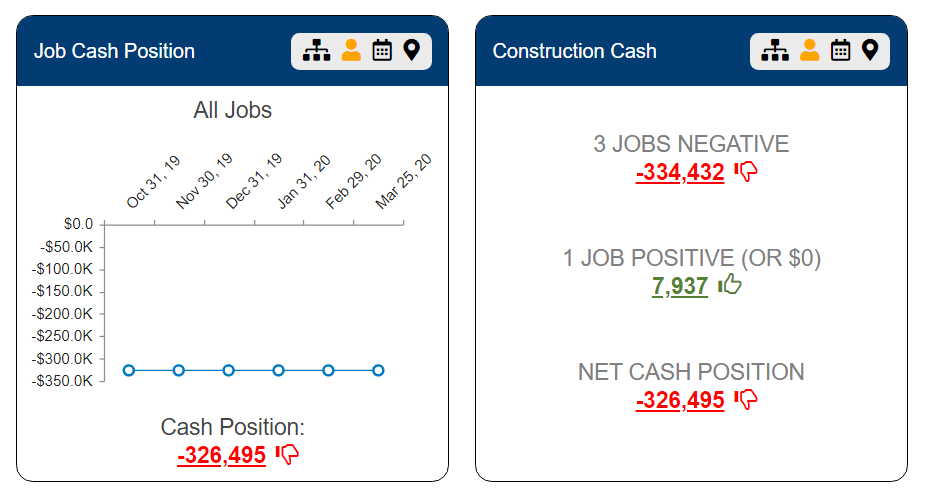
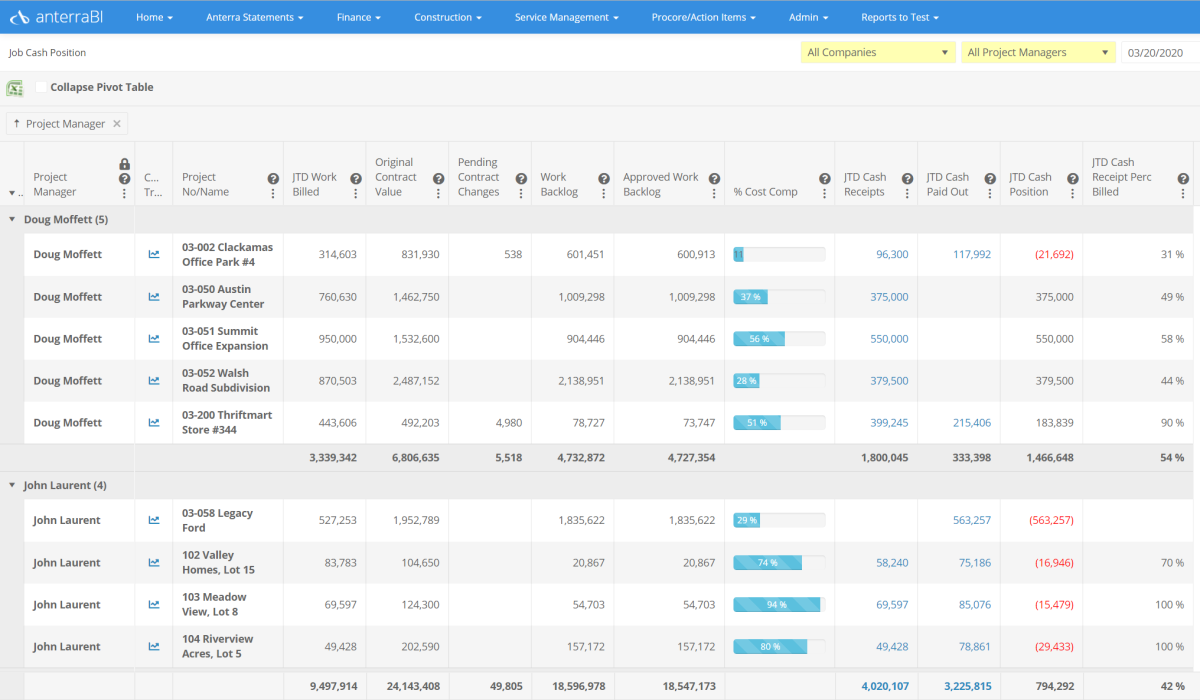
Job Cash Management
Are your customers paying you fast enough to cover your AP and payroll costs or are you financing jobs with your line of credit?
You need to manage your cash flow or risk running out of credit.
With Anterra you immediately see who is financing your job on a dashboard and on a drill through pivot grid.
We observe that it is typically one or two project managers per client that consistently have negative cash positions. This can be caused by late billings or job issues that cause your customer to withhold payment. You need to know who and what is tying up your cash and remedy the situation.
Our job cash position dashboard widgets and pivot grids lets you analyze your cash by any attribute to get control over your funding.
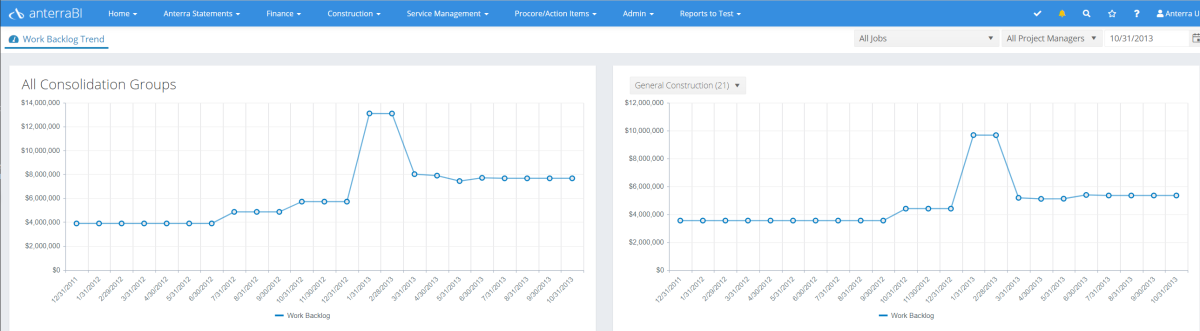
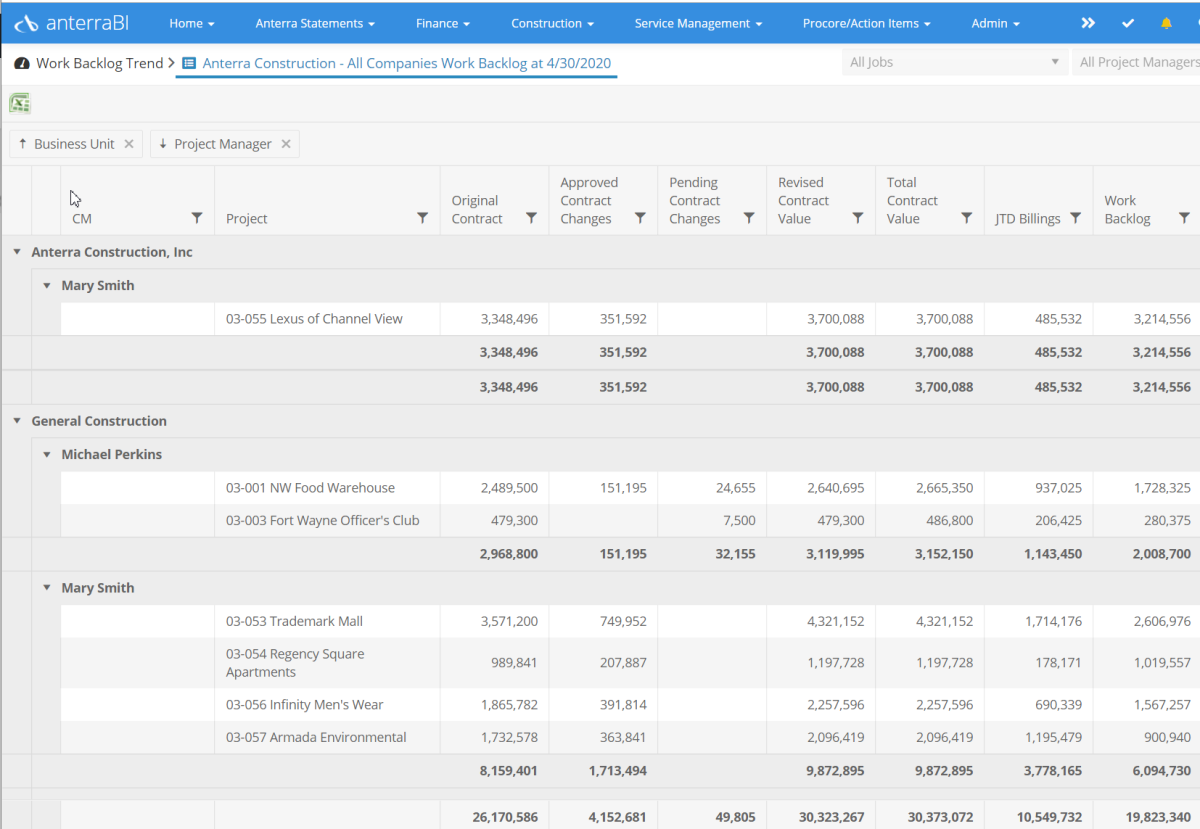
Work Backlog
Work backlog over time is one of your most important KPI’s.
We show you the trend of work backlog for all your companies/divisions as well as the trend for a specific division.
Trend graphs drill to work backlog by Company and Project Manager at the date you drilled on.
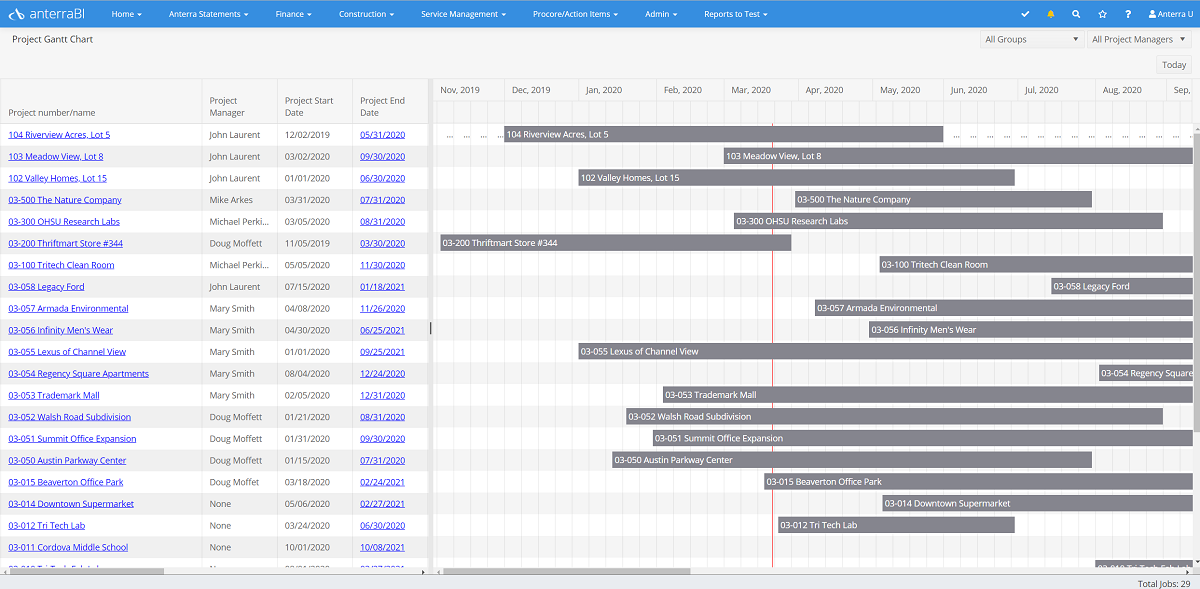
Job Scheduling
Very few construction companies have an overall view of job scheduling.
Construction schedules are typically maintained by project managers outside of their accounting systems in MS Project, Primavera P6 or Excel.
Most companies do not give their project managers access to their accounting system’s job record where job start and end dates are stored. Your finance team is in the dark managing WIP as they have no idea which jobs are construction complete.
Anterra provides a central Gantt Chart to manage your project start and end dates in one central location.
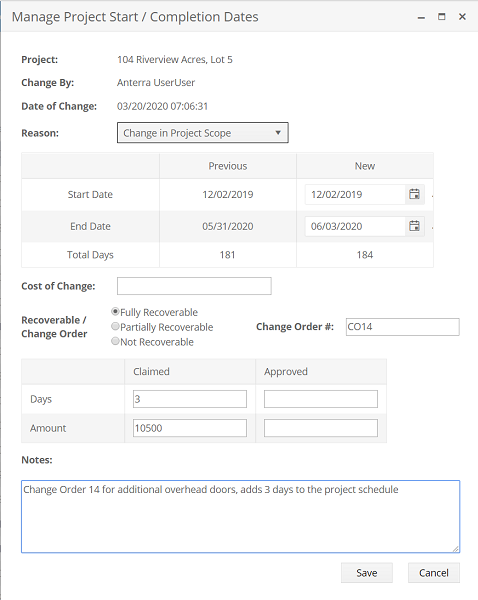
When a project end date is changed it is tracked along with the cost of the change and if it is recoverable. A log of date changes is available for every job showing you the history and cost of date changes. You control the list of change reasons.
By managing project dates centrally you have more accurate WIP and can start forecasting job cash flow (see below).
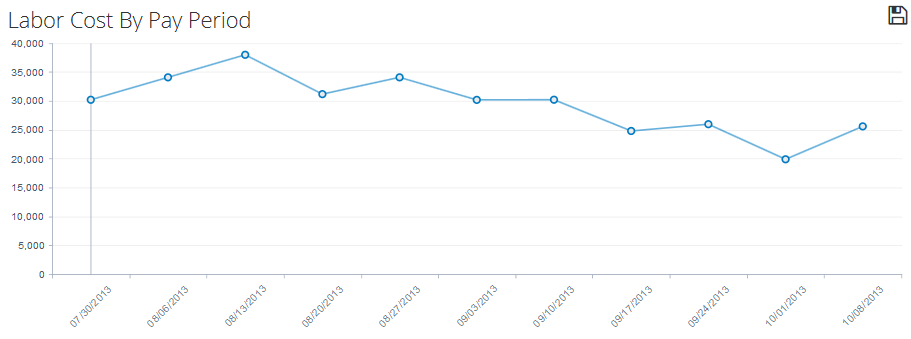
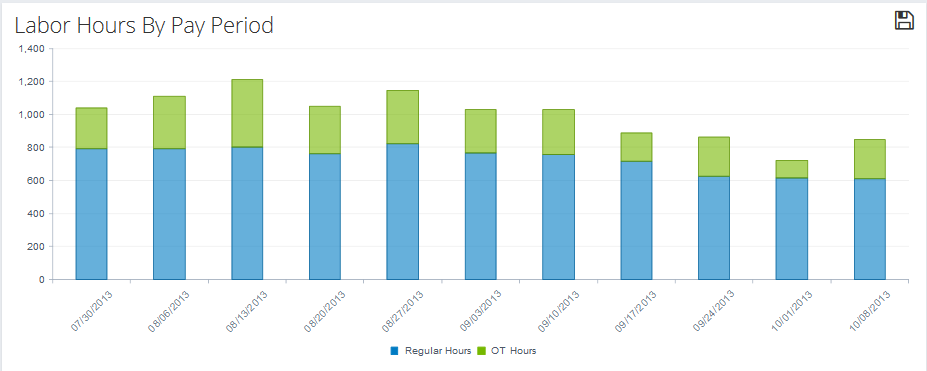
Labor Cost Analysis
Anterra has labor cost and hour reporting covered. We have dashboard widgets and detailed grids that drill to transactions that include
- % Labor Hours Complete
- % Labor Cost Complete
- Labor Rate Variance
- Forecast Labor Cost Variance
- Labor Hours by Pay Period
- Reg vs OT hours
Our JTD Labor by Job Grid can be customized with any job attribute or cube calculation you like.
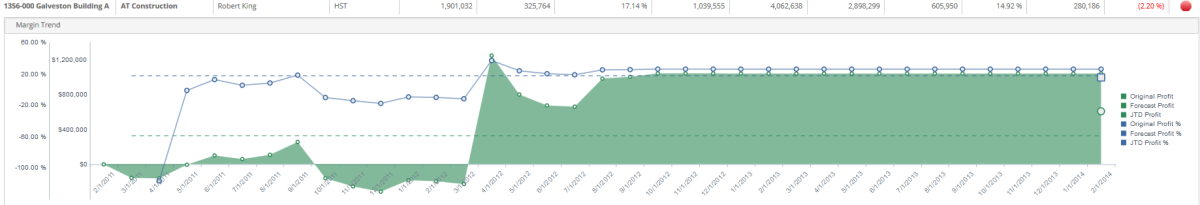
Final Margin Analysis
Final Margin Analysis lets you analyze profit and fade over for closed jobs over a range of dates.
Most construction companies do not have a way to benchmark jobs, Anterra gives you a deep understanding of where your company makes and lose money.
This key function lets you understand final profitability by Project Manager, Job Type, Estimator, City, State, Division or any other attribute.
Job Cash Flow Forecasting
Job Cash flow concepts:
- Cash flow forecasting must be automated. It is better to have a 90% accurate automated forecast than no manually generated forecasts.
- Jobs have Project Types assigned
- Template Job S-Curves by Project Type will be set up with typical days, % cost complete, % billed, and field labor hours
S-Curve Reporting
S-Curve graphs for each project that can turn lines off and on for:
- Labor Hour and Cost Planned Curves
- Actual Labor Hours
- Actual Labor Cost
- Planned Actual Cost
- Actual Total Cost
Cash Flow Reporting
Available reports:
- Projected Project Cash Flow over time
- Projected Gross Margin over time
- Projected Gross Margin vs GL Budget – shows you how much work you have to win in the future to make budget
- Bid Work Pipeline – import your bid work with contract size, start and end data and probability of winning.


online Job Tools can work for your team