
Anterra Works for Specialty Contractors
Manage the right construction metrics. Empower your team and hold them accountable.
Eliminate spreadsheets for AR Collections
Learn how to collect faster
Track the promised payment date of invoices with Anterra’s AR Collection system.
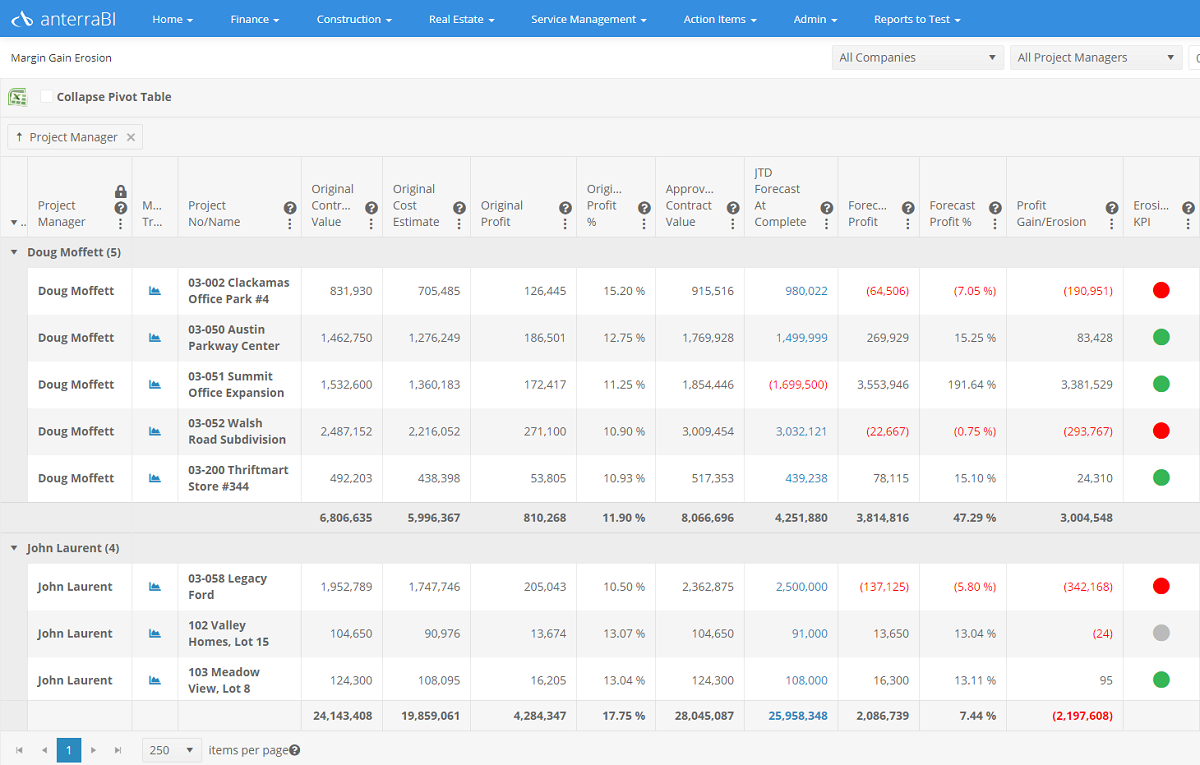
Financial Ratios are game changers
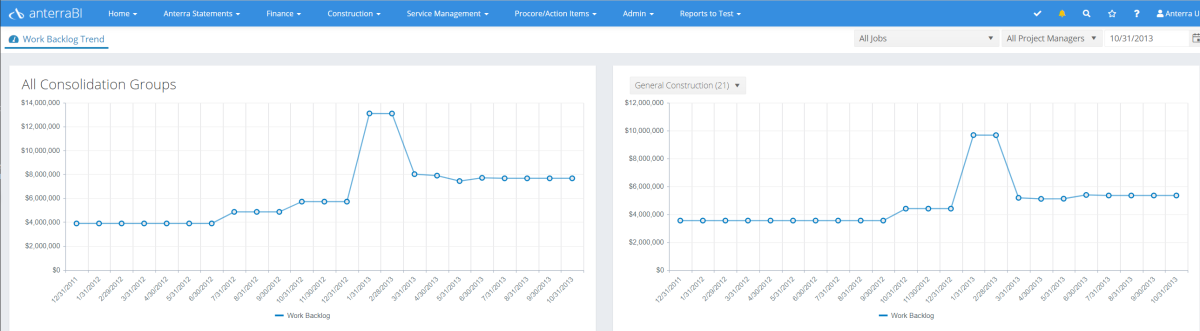
Build trended ratios
Create your own Financial Ratio dashboards with trended days sales in AR, current ratio, quick ratio, or any other liquidity ratio.
Tools for managing the
COVID-19 Crisis
COVID Management
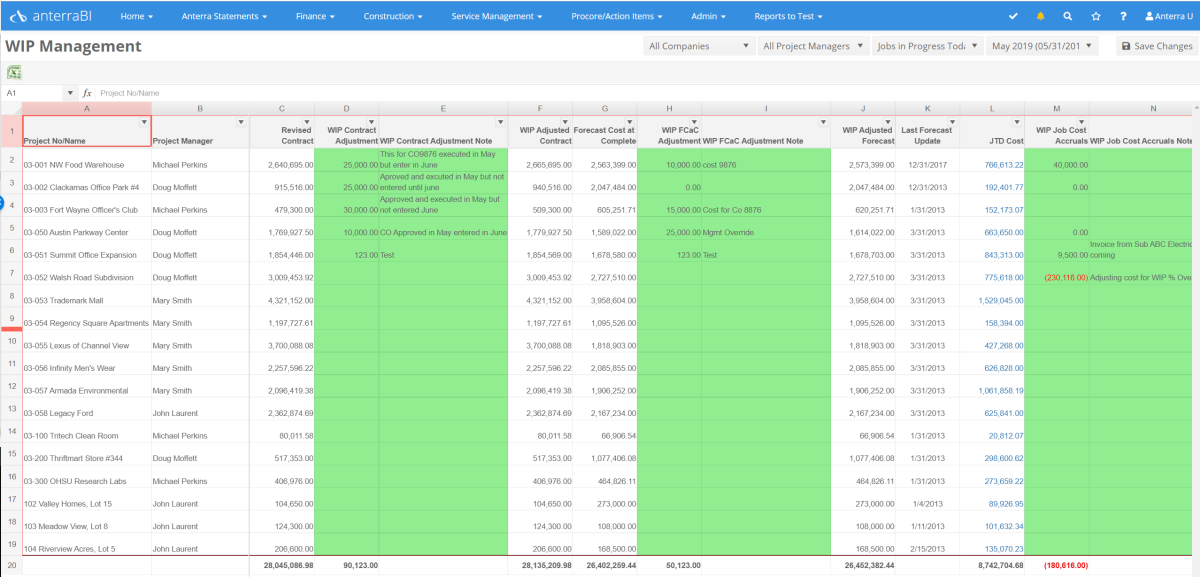
Manage AR Collections, assess the impact of your COVID cudget to your original budget, online job forecasting, WIP management, and more…
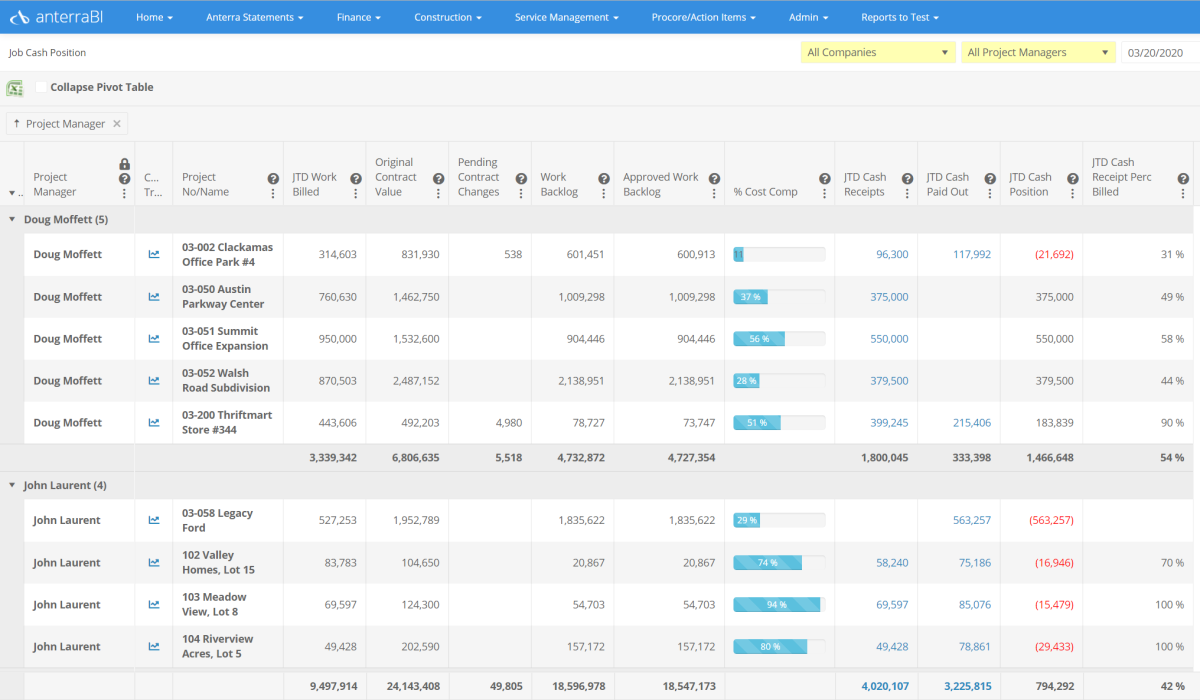
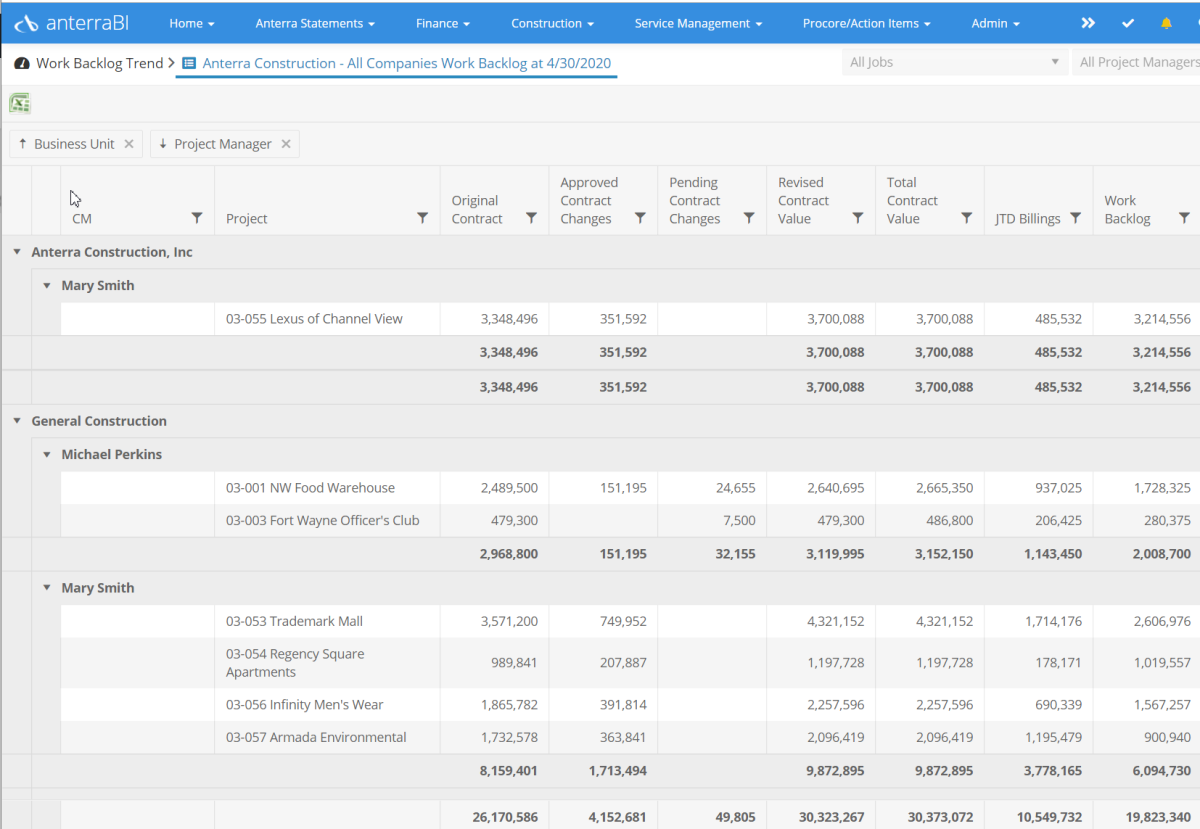
Construction Business Intelligence Overview
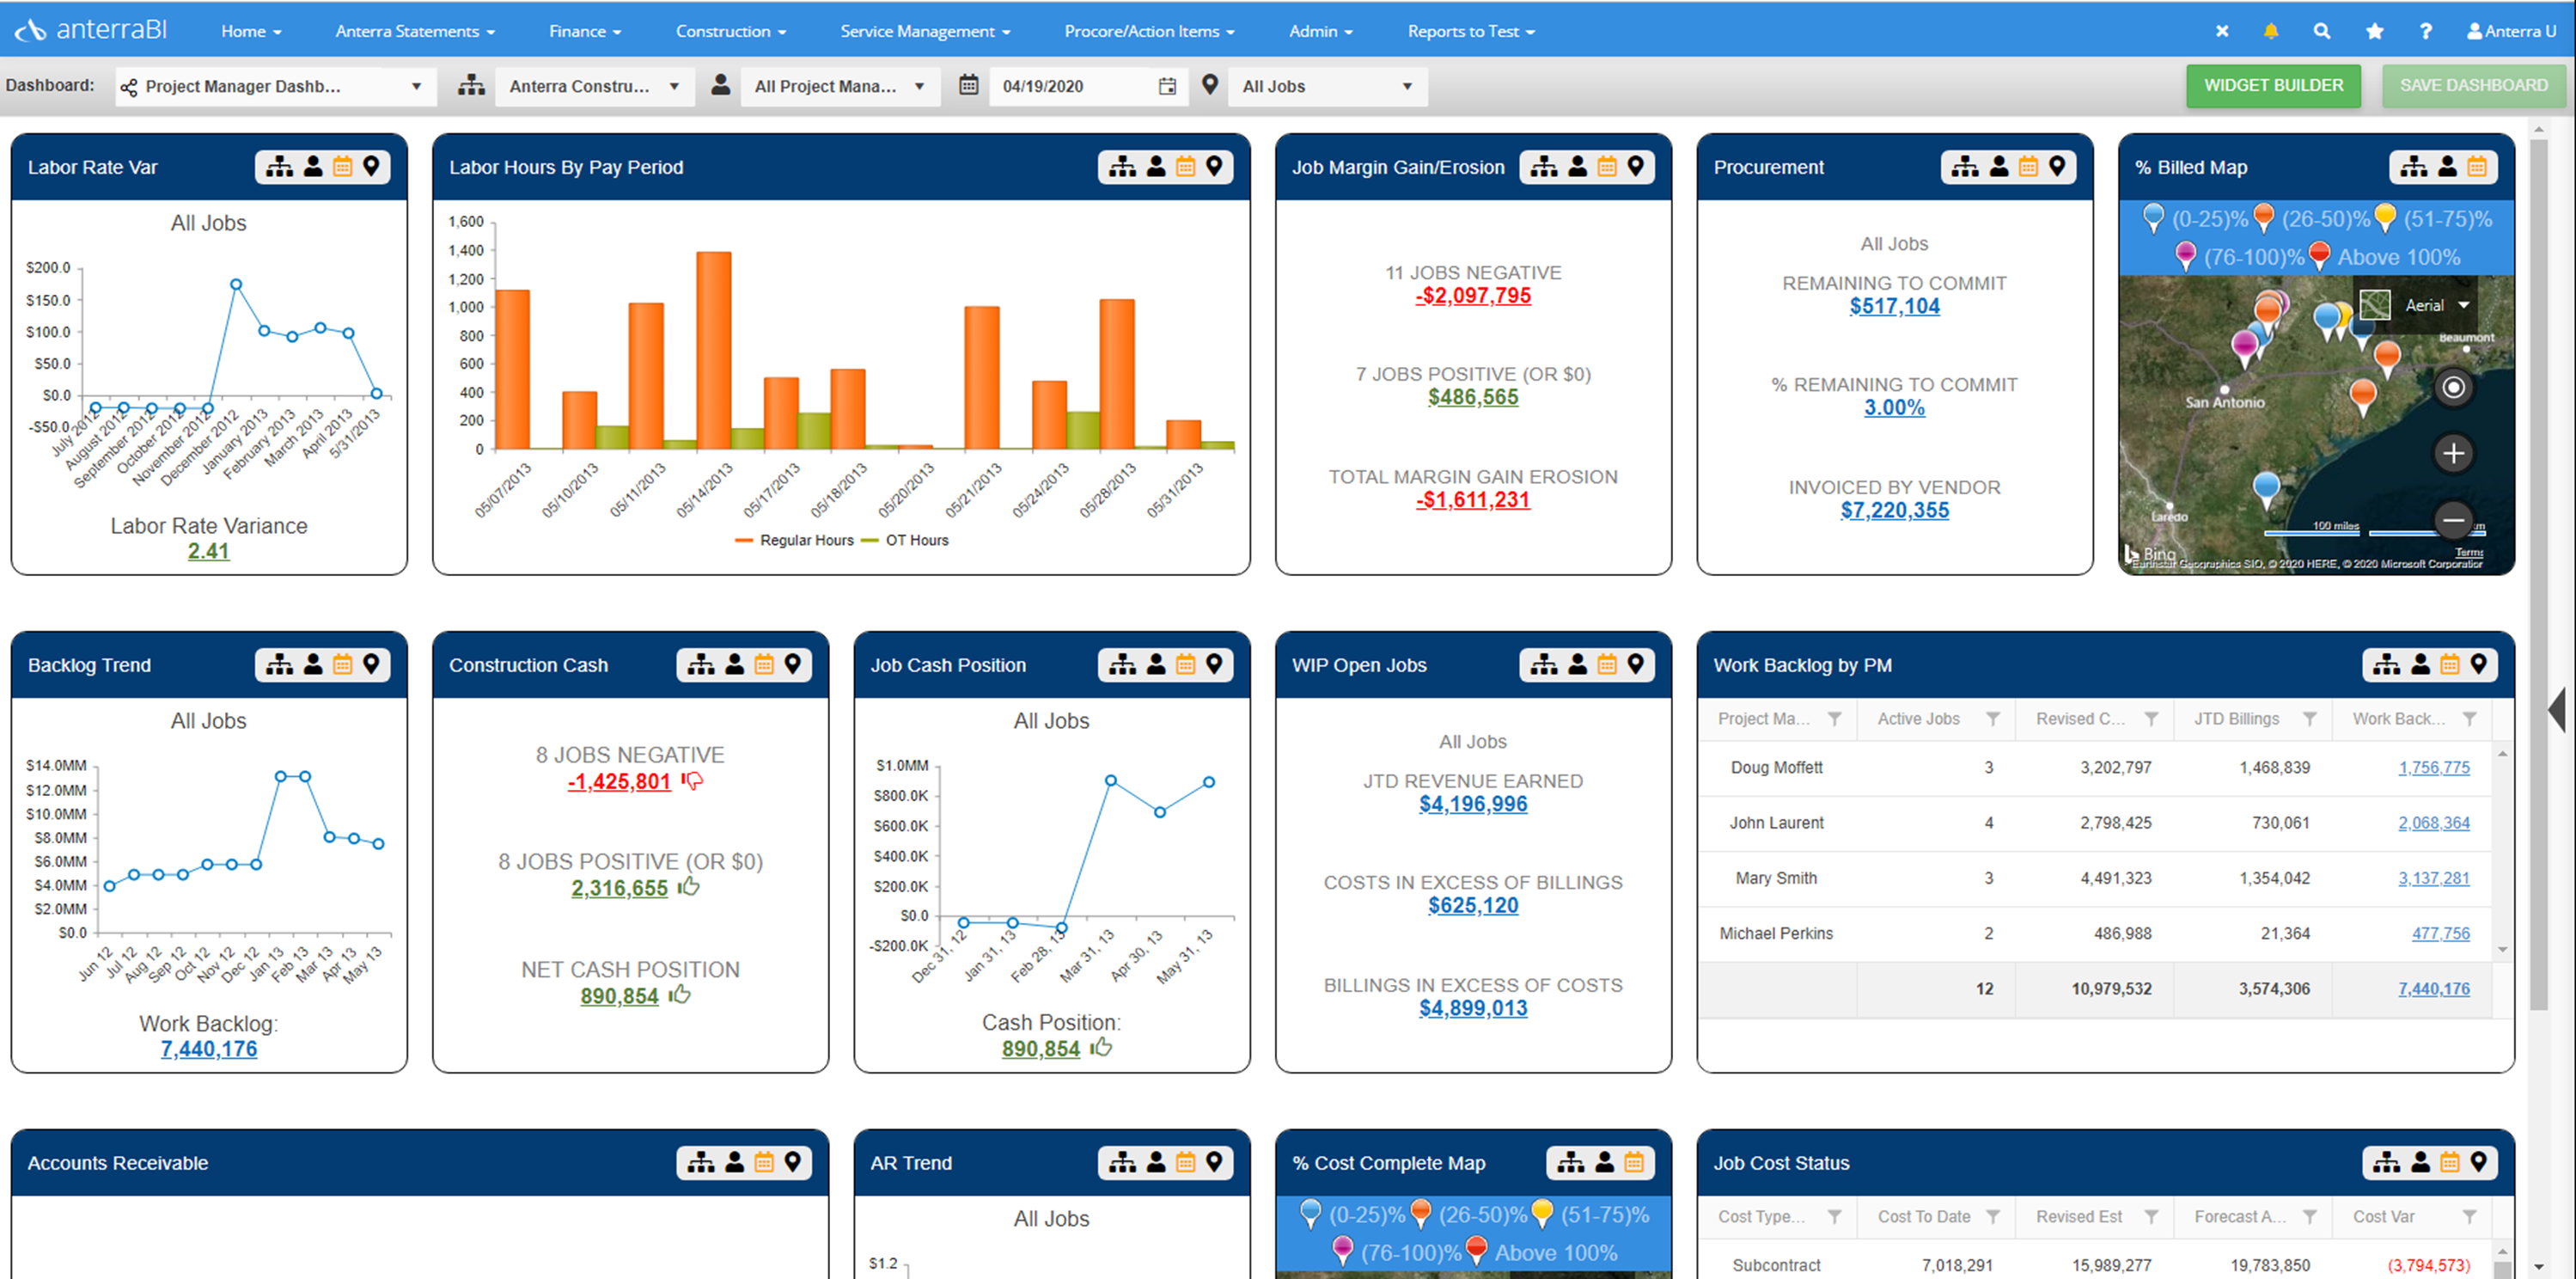
Build Dashboards with Margin, Labor, Procurement, Cost, Contract, WIP, Procore, and Financial Performance Components

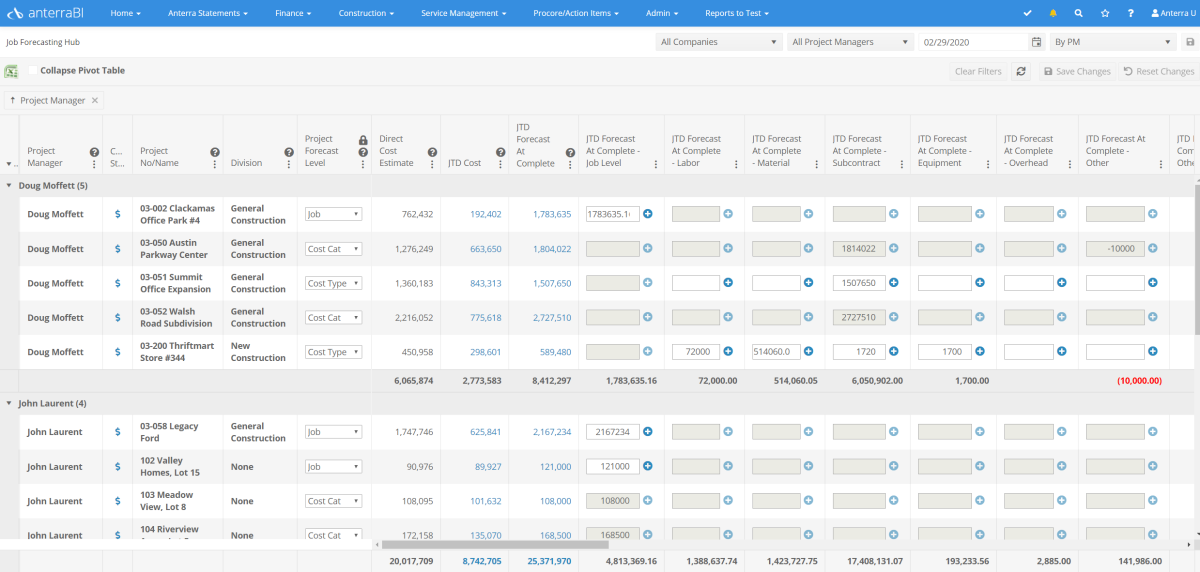
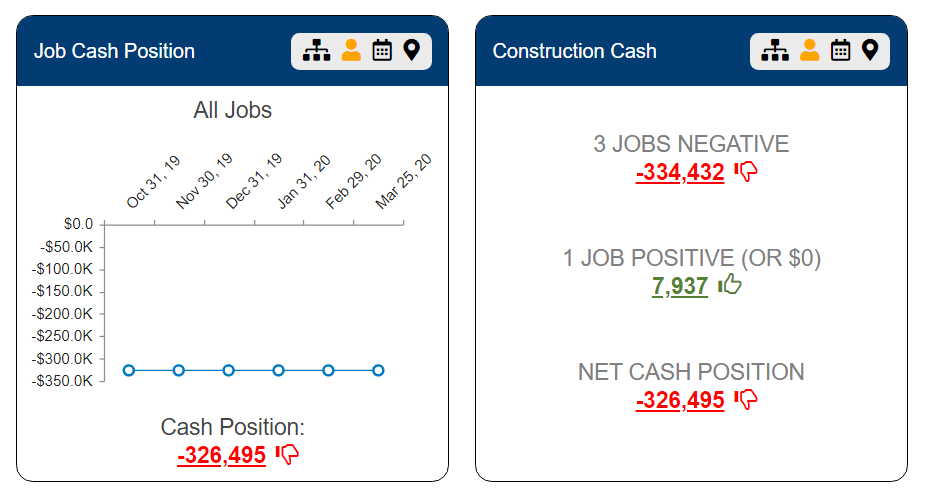
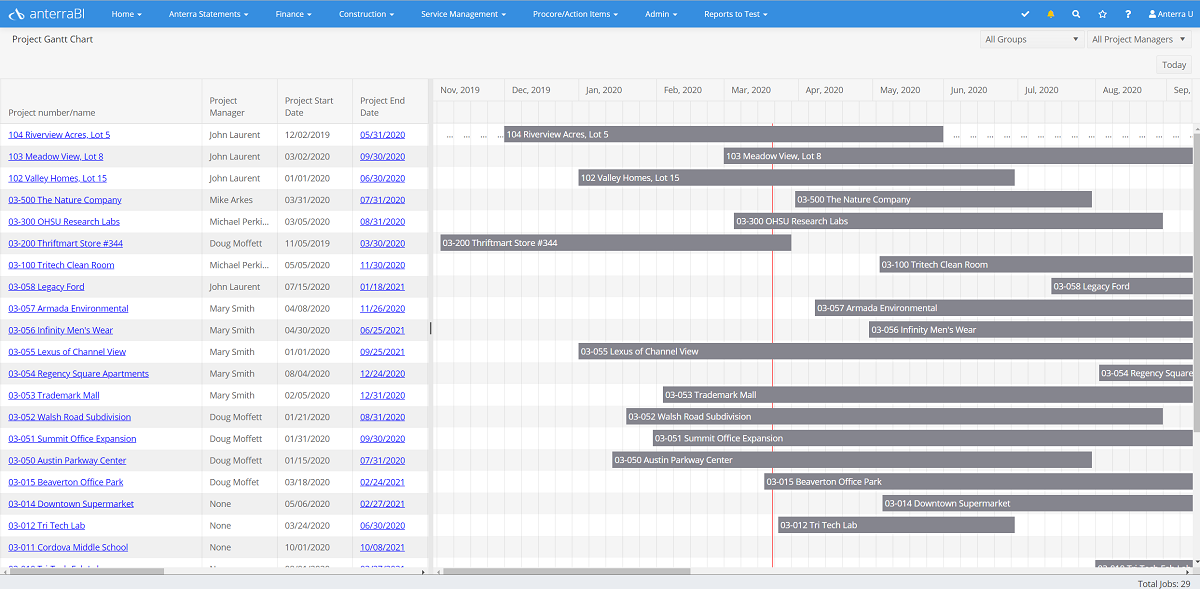
Job Cash Flow Forecasting
Job Cash Flow Forecasting concepts
- Cash flow forecasting must be automated. It is better to have a 90% accurate automated forecast than no manually generated forecasts.
- Jobs will have Project Types Assigned
- Template Job S-Curves by Project Type will be set up with typical days, % cost complete, % billed, and field labor hours
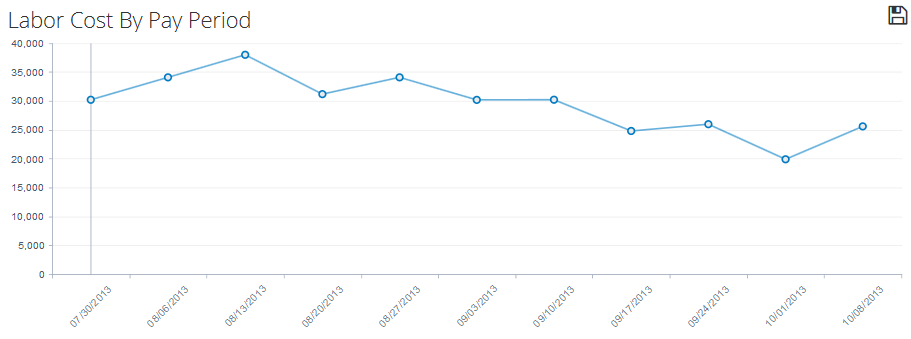
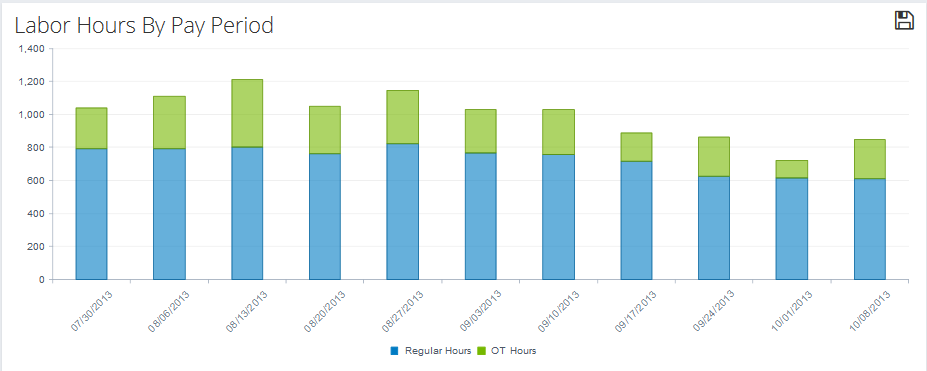
S-Curve Reporting
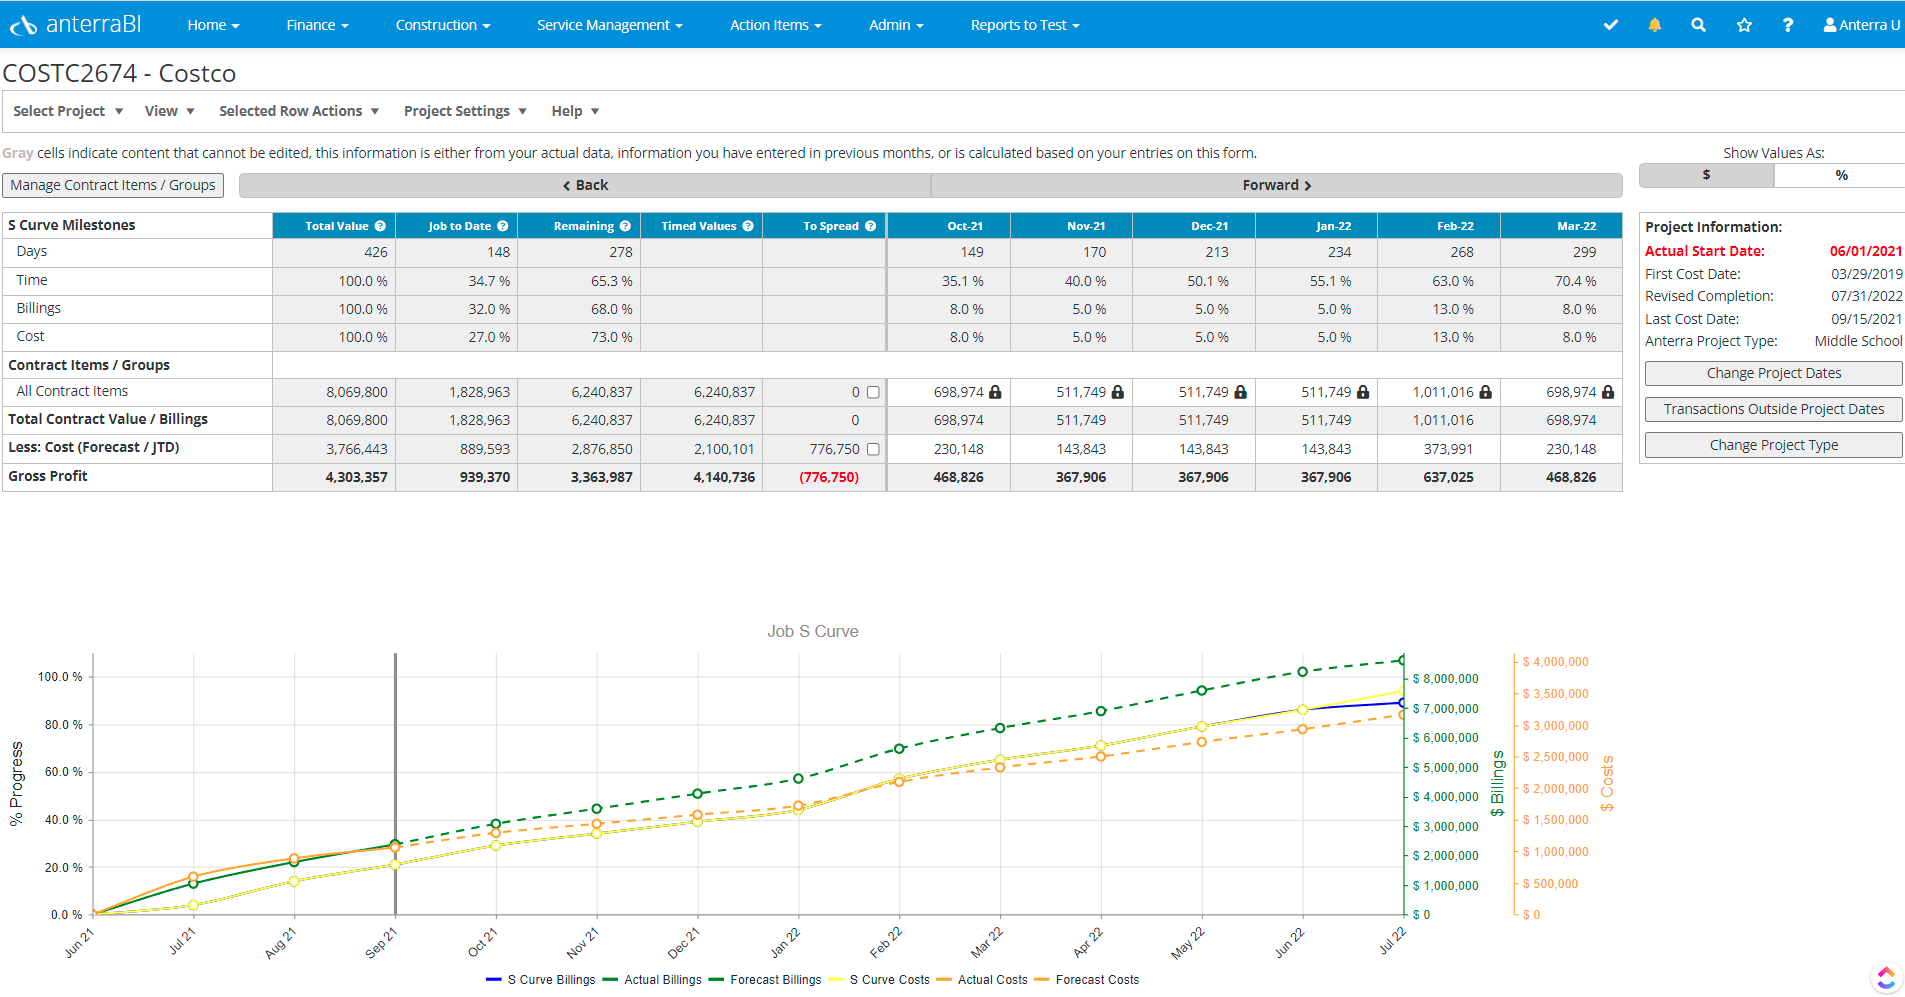
CLICK TO EXPAND
S-Curve graphs for each project that can turn lines off and on for:
- Labor Hour and Cost Planned Curves
- Actual Labor Hours
- Actual Labor Cost
- Planned Actual Cost
- Actual Total Cost
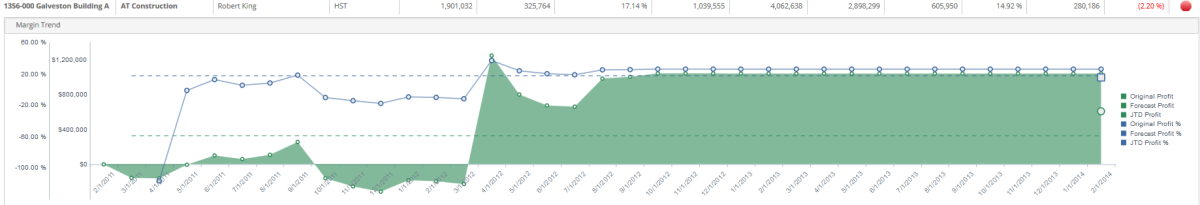
Cash Flow Reporting
Available reports:
- Projected Project Cash Flow over time
- Projected Gross Margin over time
- Projected Gross Margin vs GL Budget – shows you how much work you have to win in the future to make budget
- Bid Work Pipeline – import your bid work with contract size, start and end data and probability of winning.


online Job Tools can work for your team